The Azure cloud provides data redundancy, global data centers, disaster recovery, SLA’s, so you would easily forget that incidents can happen. It might not be likely, with all the automatic healing, and services within Azure, but in case something is down, it is crucial to be able to have insights in what is happening, and even better, to be in control. This article describes the several options available for global Azure monitoring, and highlights the features in Azure Service Health (Azure Status)
Azure monitoring
Azure contains a massive amount of services, and provides an extensive set of monitoring services. Monitoring can be done roughly on these levels (this is an short overview, more services are available):
Application level - for this Application Insights is ideal, it provides analytics on all events monitored (out of the box, custom events, and even events from Azure services), and has some powerfull features, such as anomaly detection, which is able to distinguish normal vs extrodinary events.
Service level - for this Log Analytics or Operations Management Suite (OMS) can be used, which enables you to log all activity within Azure resources, and specify metric based alerts (such as spikes in data in / requests etc)
Cloud level – Azure Service Health monitoring is a valuable service, which helps in case of any interruption, events within all of the Azure datacenters, and services, which might have impact for you as a customer.
In this article we’ll describe the following Azure Service Health features:
- Portal feature
- Health Map - which can be used in the Azure portal and show the actual status
- Monitoring features
- Health Alert - which is an type of alert fired when an issues is detected within Azure, impacting resources
- Action group - which is used to send out alert information, and which can help to trigger workflows
Portal feature
Health Map
Within the Azure portal it’s easy to setup an Azure Service Health map, it takes only a few clicks.
- We login to the Azure portal
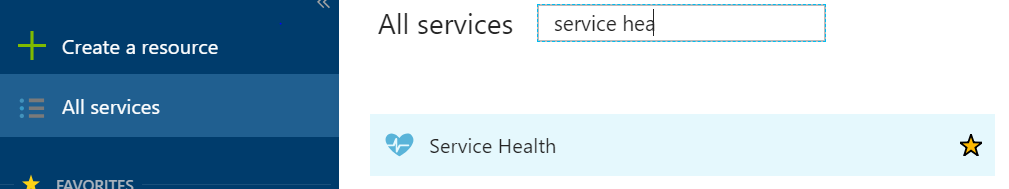
- Click all services, filter on “Service health” (suggestion: mark it as favorite)
Within the service health blade it’s possible to setup the map, but also view:
a. Service issues (any issues within Azure)
b. Planned Maintenance (planned activities by Microsoft)
c. Health Advisories (adivise based on service issues by Microsoft)
d. Health History
e. Resource Health (current status)
f. Health Alerts (configured alerts)From the tab ‘Service Issues’, perform the following actions:
a. Select the subscription(s), for which Health alerts needs to be monitored
b. Select the regions which are relevant
c. Select the services used to monitor
d. Click on ‘Pin filtered world map to dashboard’
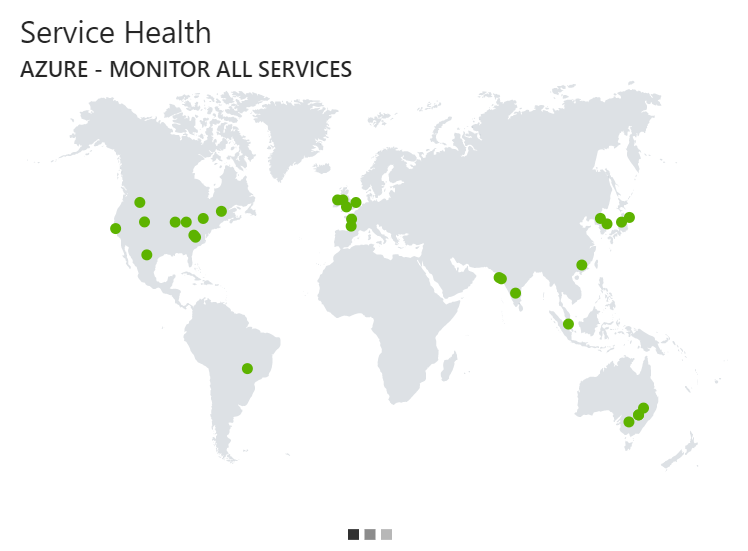
Navigate to the Azure Dashboard (close all blades/tabs), and a similar maps as shown below is now added, any issues with the selected region/applicable services are displayed in the map
Monitoring features
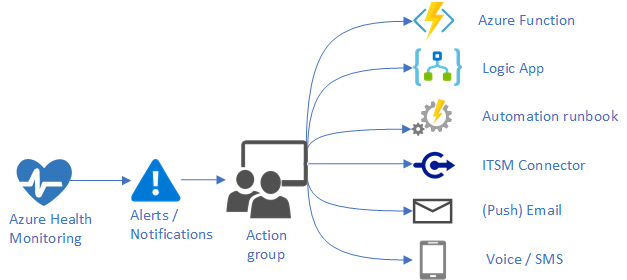
In case an issue is detected by the Azure Service health, an alert is fired. In order to do something with this alert, an action group needs to be linked to this alert.
The action group is configured, and based on the action type, information is pushed to a service. This flow has to following steps, in this section each step is explained
Azure Health monitoring
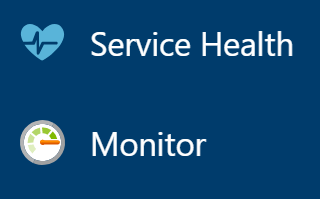
This is the service which enables the health monitoring. Click on ‘Health Service’, this can be done through the menu item ‘Health Service’, or within the ‘Monitor’, in the section: ‘Service Health’
Now click on ‘Health Alerts’ in order to set up a new rule.
Azure Health alerts
We can now define alerts and specify which subscription, service, region is monitored;
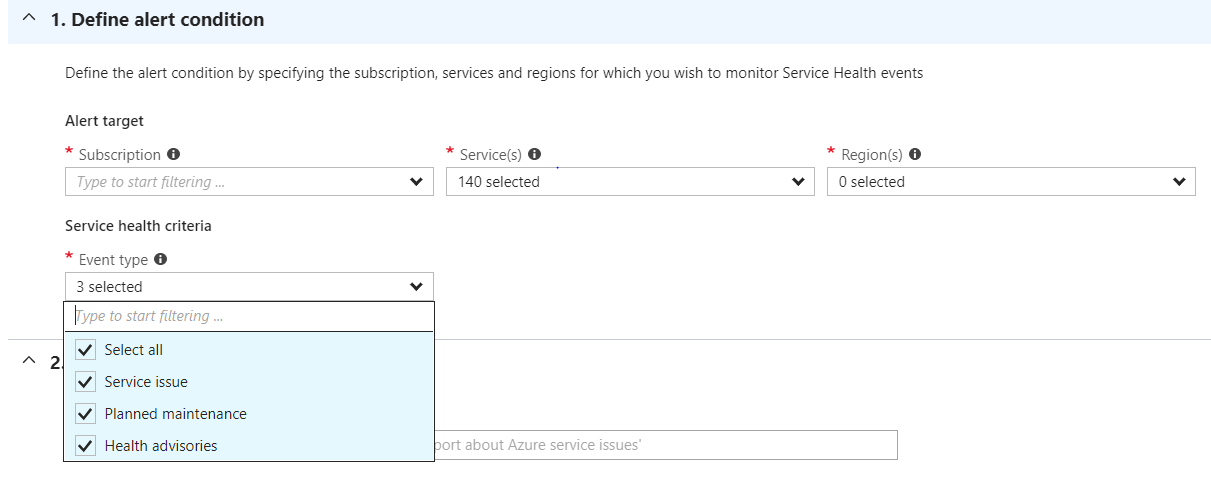
- Define the conditions
- Select the Event types, the following event types can be selected:
- Service Issue - outage/issues within Azure
- Planned maintenance - Azure service affected by scheduled maintenance (notitications are sent upfront)
- Health advisories - suggestions by Microsoft to mitigate problems base on a Service issue (e.g. routing data etc)
- Enter the alert details
- In case there is no action group, ‘Create a new Action group’ *
Action group
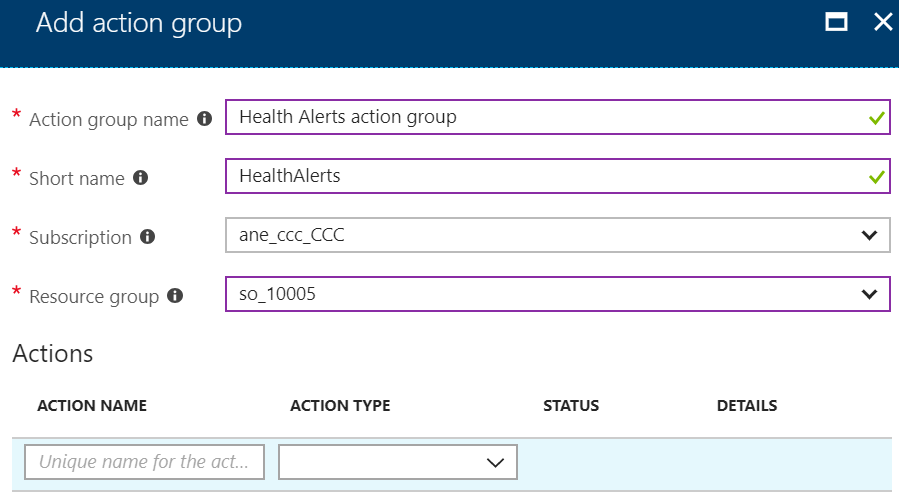
The action group is a definition, what actions are taken, in case an alert occurs. The action group is basically a container which can be linked to an Alert, in which Action types can be defined.
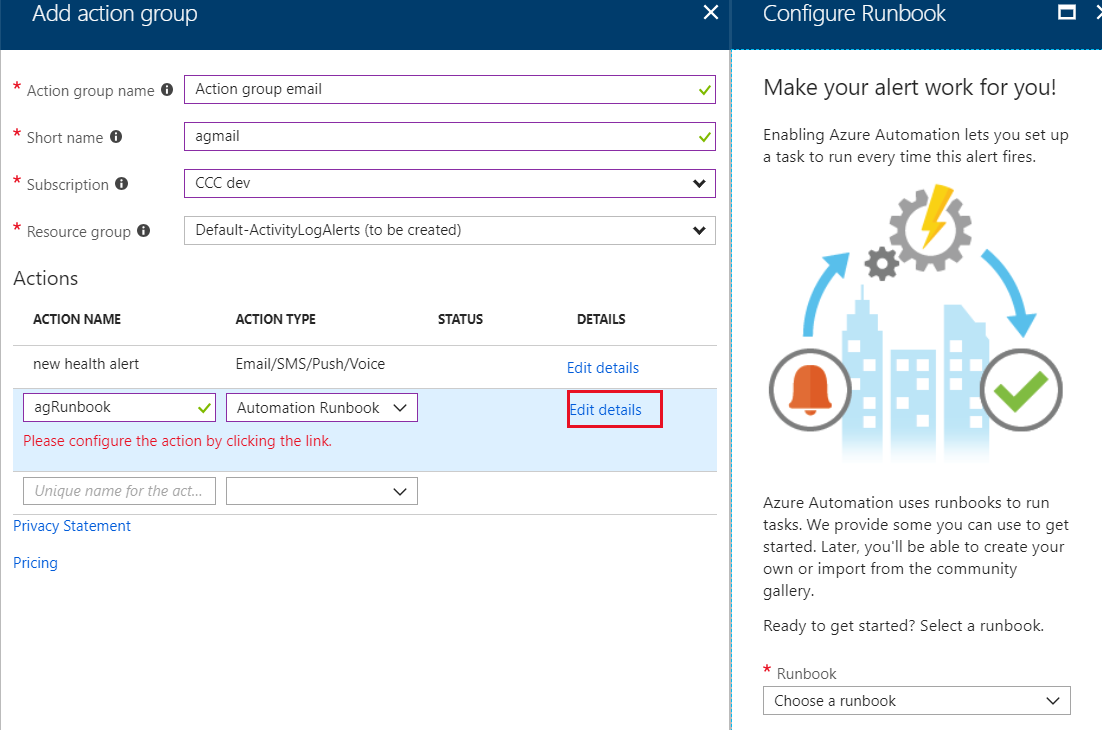
- Choose the subscription / resource group
- Select one or more action types
a. Configure the action type
Considerations:
- An email-sms-voice seems to be the most obvious types of alerts to use, as it’s a risk to let a function/logic* app handle outage, without being sure that the outage is affecting these types of services.
- A WebHook, could be very interesting, as it allows you to notify an external hosted service.
- To mitigate problems, the Azure Automation Runbook enables you to run a workflow, such are shutting down services ** changes routes, so that the impact is limited.
- The ITSM connector,*** which can create service tickets in your preferred service management tool.
* Functions/Logic apps needs to be defined in the subscription in which the Alert is defined
** The Automation RunBook, is either a standard one, or the one saved in the User library.
*** The ITSM is a connector, which supports the following service management tools: ServiceNow, System Center Service Manager, Provance and Cherwell
Automation
ARM template
Based on our configured alert, it’s now possible to create additional alerts, and use the existing configuration as an template. With the Azure resource explorer, we can navigate to our subscription, select the Operation privder ‘Microsoft.Insights’ and view our template and re-use this. It’s also possible to use the Azure Template feature, and deploy directly from within Azure, an example of such a template can be found here: Service Health Template.
This blog is written by: Sander Nefs